 |
 |
 |
 |
| Just the axes of the plot | Enterococcus distribution spread along the beach |
Coliform distribution at a single lcoation |
Enterococcus and Coliform |
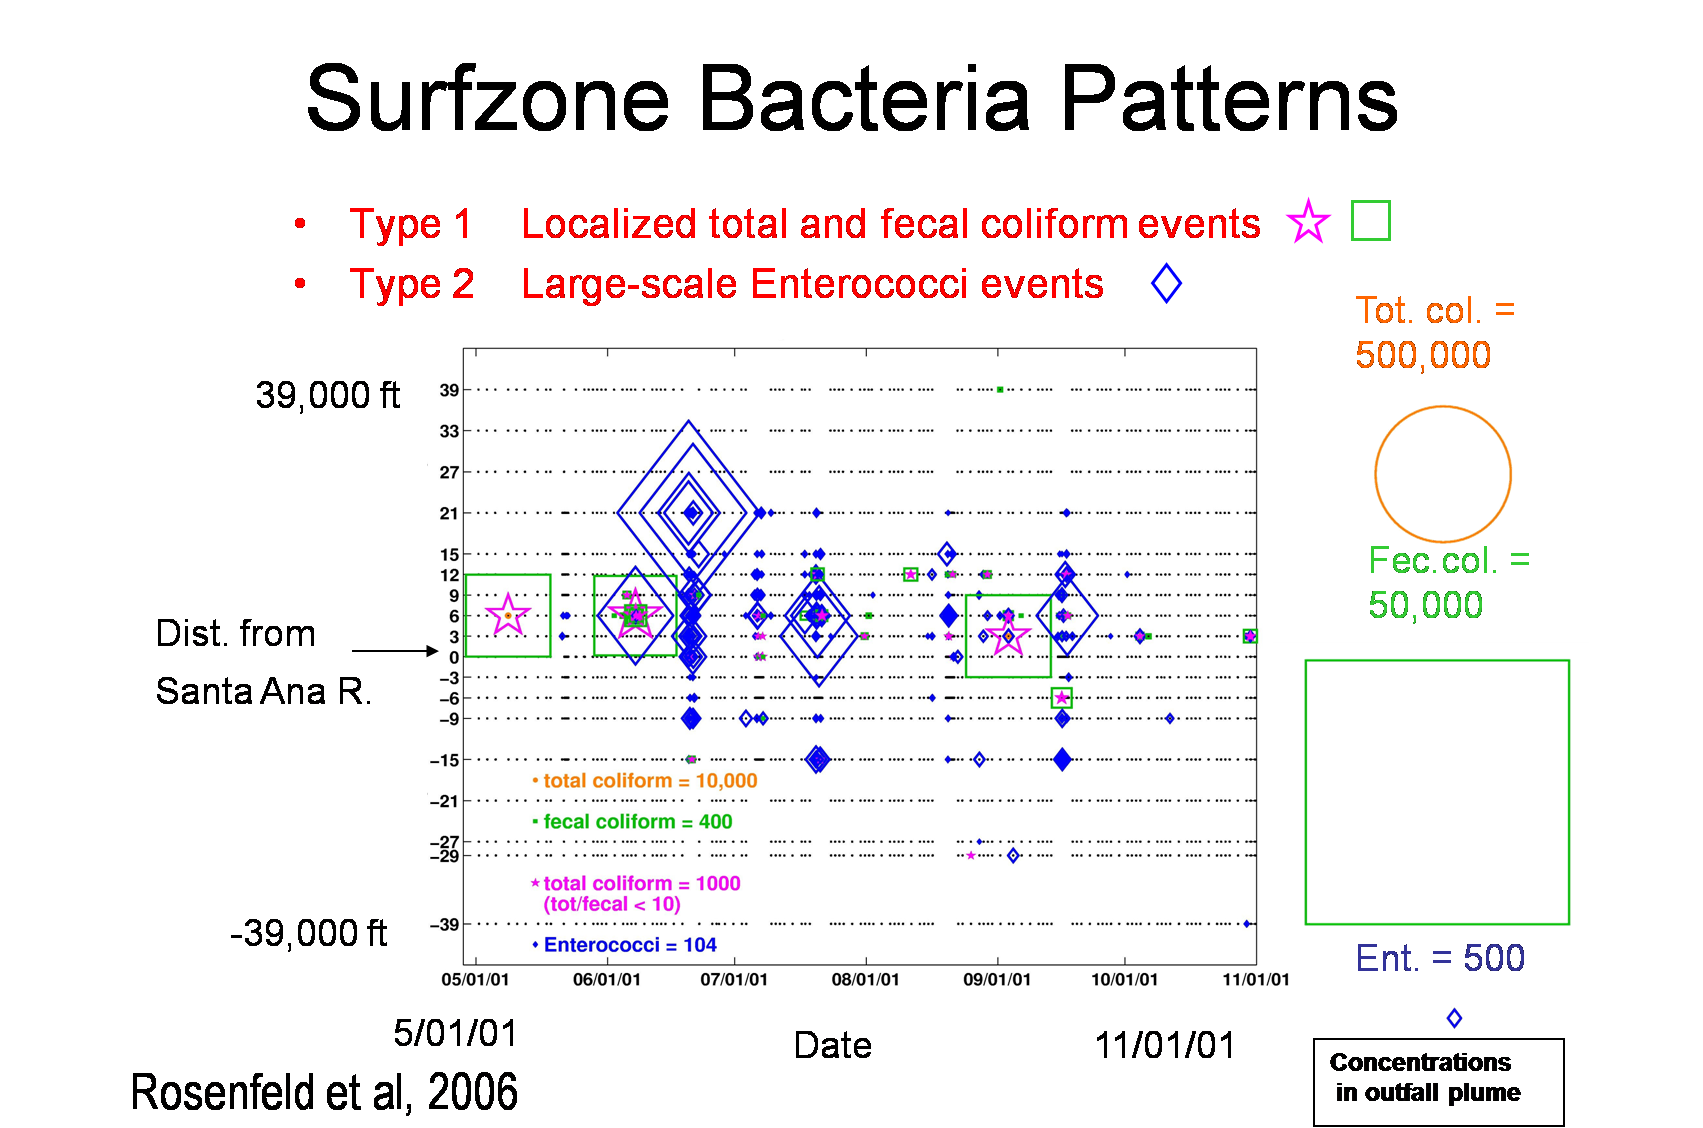
Objective: Interpret a complex plot of bacterial concentrations at different locations on the beach. Determine whether different types of bacteria are likely to come from the same source, and which type could come from the sewage outfall. (Reference: Rosenfeld, L.K., C.D. McGee, G.L. Robertson, M.A. Noble, and B.H. Jones, 2006.Ā Temporal and spatial variability of fecal indicator bacteria in the surf zone off Huntington Beach, CA.Ā Marine Environmental Research., volume 61, pages 471-493)
For this assignment, you must first print this plot and this worksheet. Now look at the map above. Find the locations of the Santa Ana River, Talbert Marsh and the OCSD sewage treatment plant.
Every day, the OCSD collects water samples in the surfzone, at locations all along the beach. They travel 39,000 ft, or 10 km along the coast in each direction, starting at the mouth of the Santa Ana river. This map does not have a scale, but I estimate that they are sampling almost from Sunset Beach to Corona Del Mar. You can check my estimate by clicking "view larger map", but be sure you know how to get back to this page.
Now look at the plot you printed out. The title is "Surfzone Bacterial Concentrations", so you know that it relates somehow to measurements taken on the beach. The y-axis of the plot is distance along the beach (not onshore/offshore as many students assume). The x-axis of the plot is time, from May through October of 2001. The lines of dots represent locations and times when bacterial measurements were made. Note that the dots are in horizontal lines, indicating that bacterial samples were made repeatedly at the same location on the beach. Every dot indicates a measurement. If that sample contained enough bacteria to close the beach, a shape is centered on the dot.
Diamonds represent the concentration of enterococcus bacteria. Each diamond is centered at a specific time and location, and the size of the diamond shows how many enterococcus were found at that location and that time. Squares represent the concentration of fecal coliforms at each location and time. So, when and where do you see large squares indicating significant concentrations of fecal bacteria? When and where do you see diamonds indicating significant concentrations of enterococcus? Do the two types of bacteria appear at the same place or the same time?
Now get a full-sized piece of paper, and draw on it the axes for this plot. You don't need all the details, but
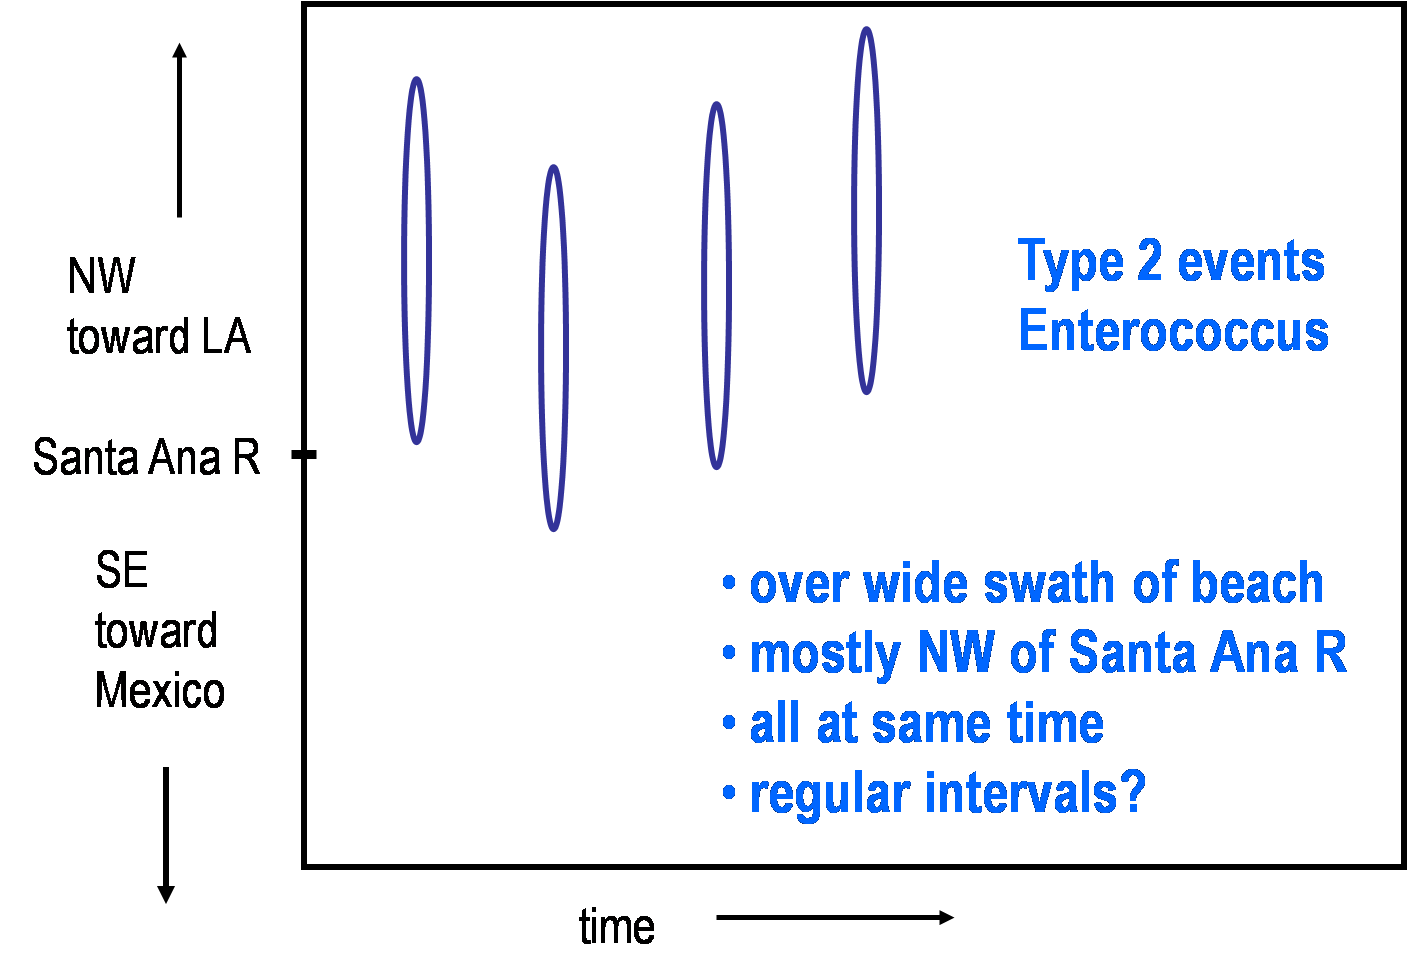
make sure you've got the information shown below, left. Look at the Enterococcus distribution - are they all in one
place or all over the beach? I chose to represent the enterococcus distribution using long,
thin blue ellipses, to show how it spreads along the beach (below).
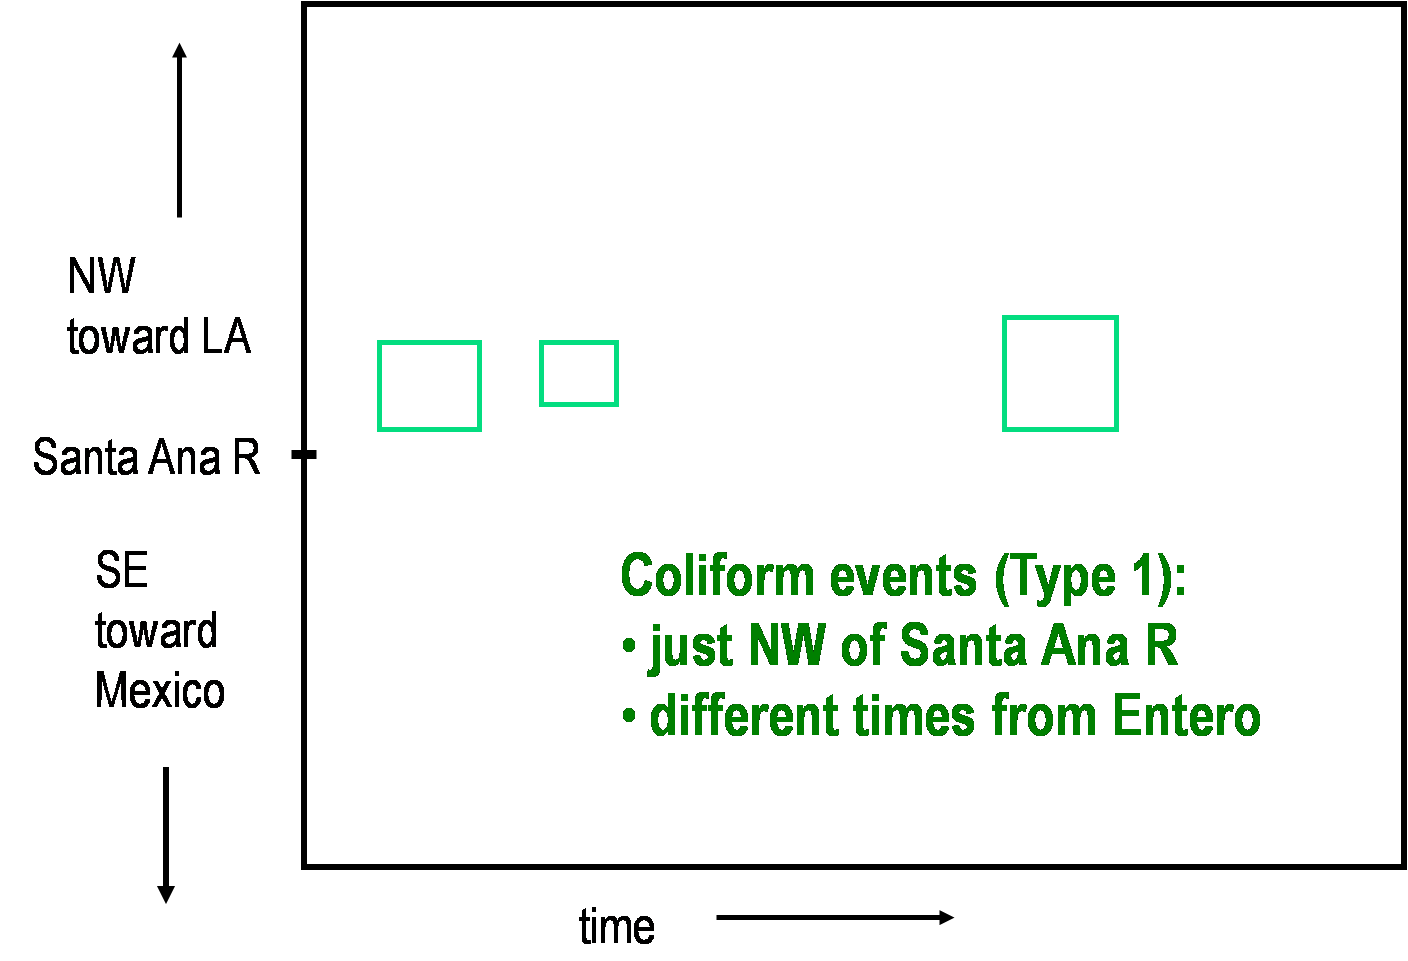
How would you indicate that distribution on your plot? Now consider the Coliform distribution -
how would you indicate that pattern? I chose to use green squares (below). When the two patterns are overlaid,
do they look the same or different (below, right)?
| |
|
|
|
| Just the axes of the plot | Enterococcus distribution spread along the beach |
Coliform distribution at a single lcoation |
Enterococcus and Coliform |
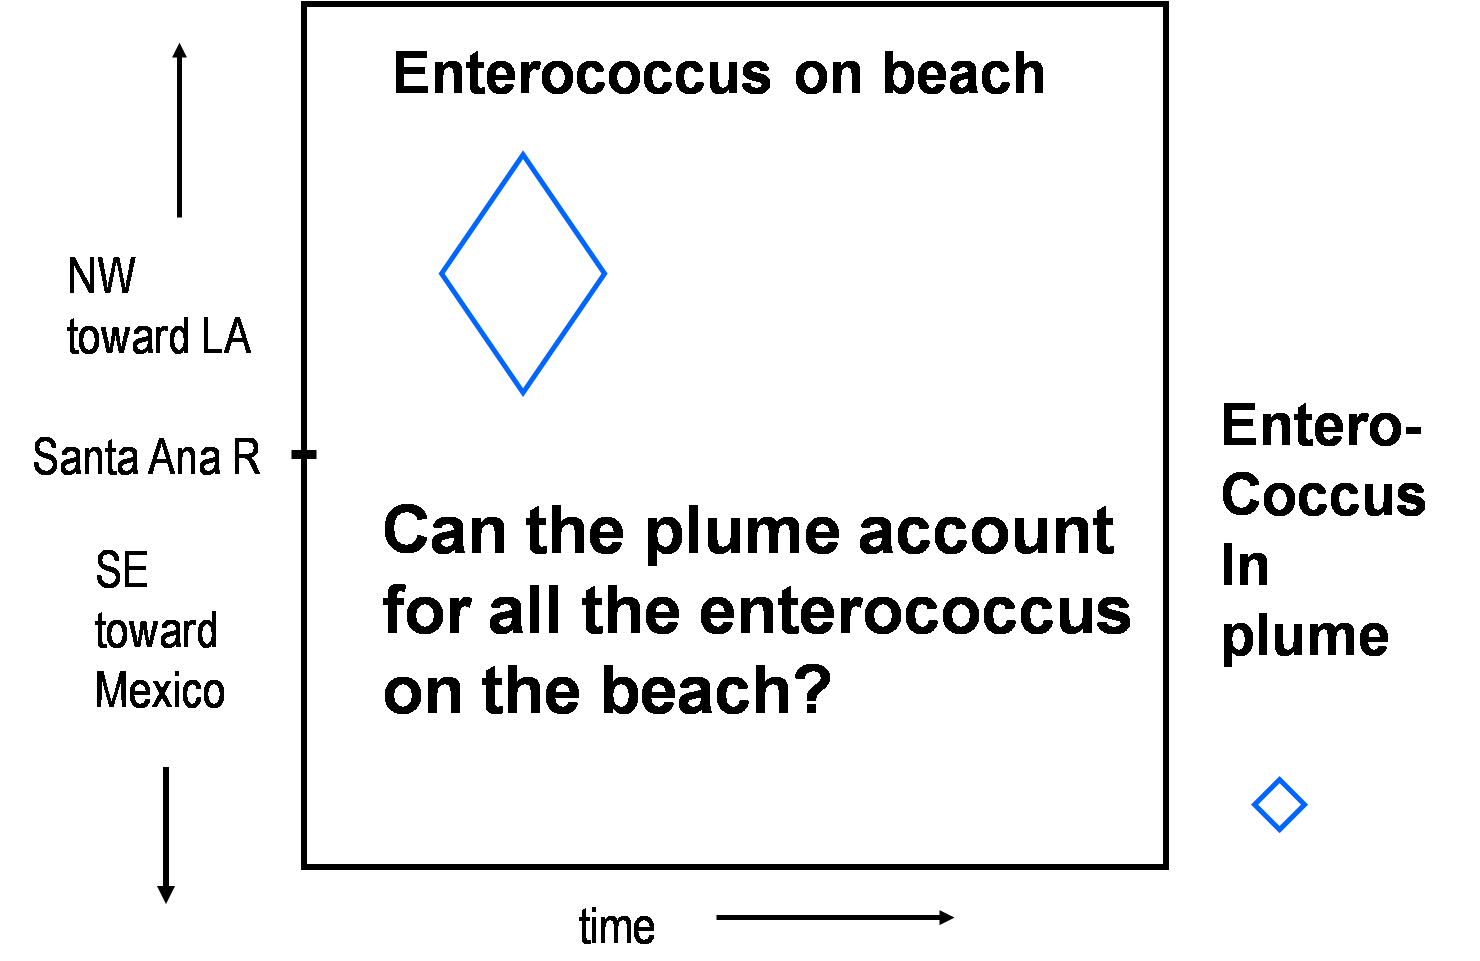
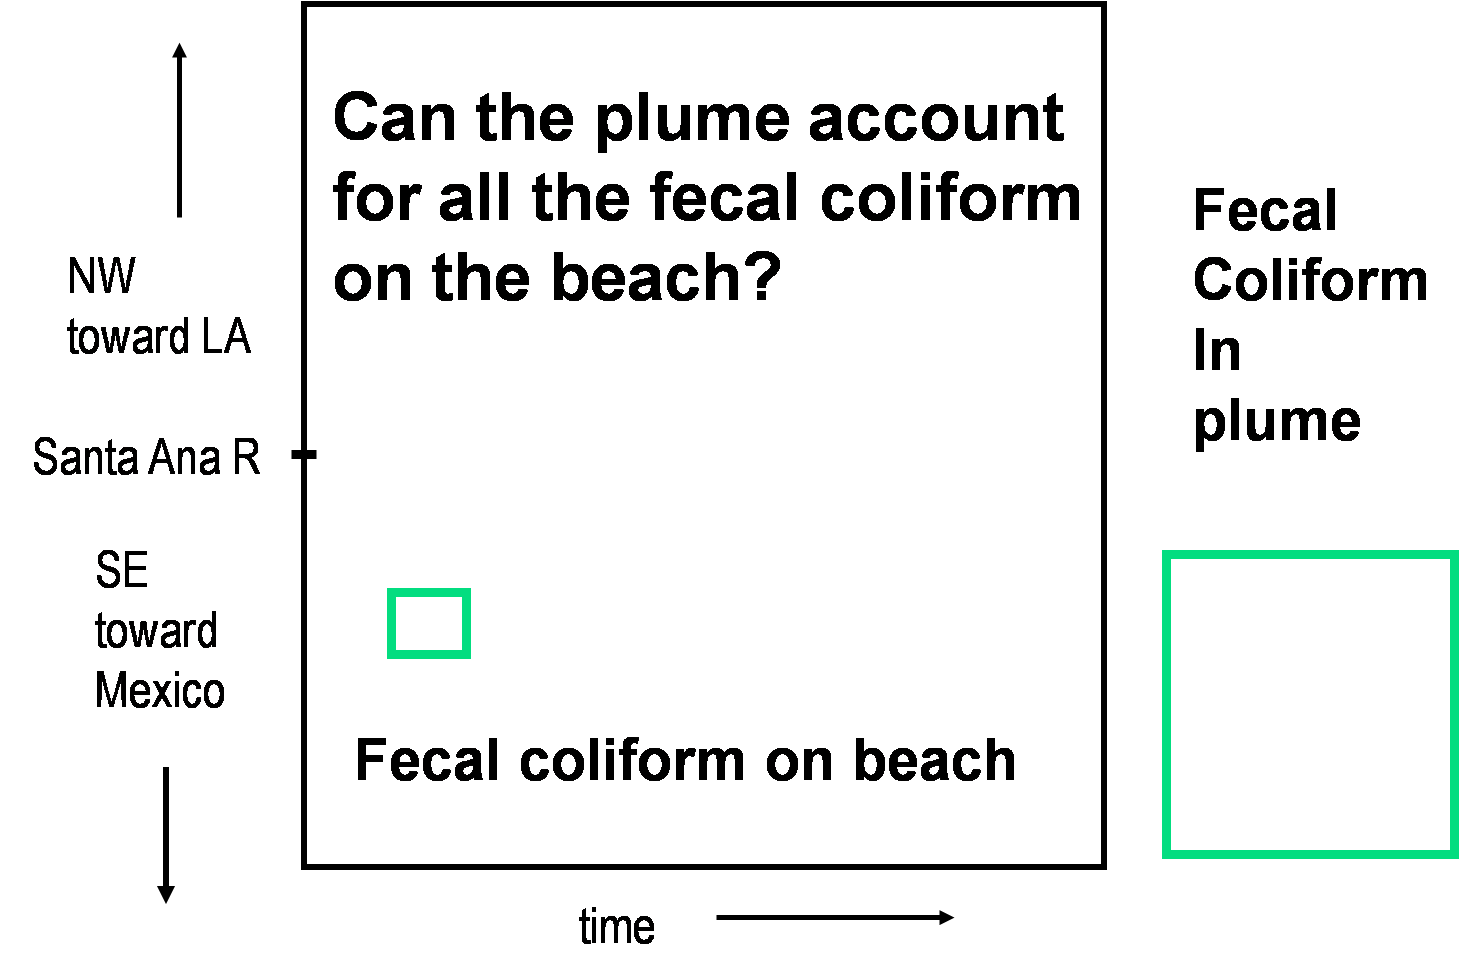
There is very important information on the right hand side of the plot as well. The square and diamond there
represent the bacterial concentration in the outfall plume. Look at the diamond representing the concentration
of enterococcus bacteria in the plume; is it larger or smaller than the diamond representing the highest
enterococcus concentration on the beach? Imagine that the small diamond is a little drop of paint at one edge of
a pan of water -- could this little drop become a really big paint spill on the other side of the pan? By this analogy,
is there any way the outfall plume could account for the enteroccus contamination on the beach? Now, paint
cannot reproduce, and bacteria can, so this analogy does not completely exhonerate the outfall, but it does make
the outfall seem less like a "smoking gun" when it comes to enterococcus contamination. Now look at the square
representing the concentration of fecal coliform in the plume. Is it larger or smaller than the square representing
fecal coliforms on the beach? Could part of this large source of coliforms account for the small beach contamination?
 |
 |
 |
| Enterococcus concentration beach > plume |
Coliform concentration plume > beach |
Complete plot from Rosenfeld et al, 2006 |
| Back to Timeline | Huntington Beach | Next: Bacteria in Cold Water |