Point Conception
Map of PISCO Study AreaPISCO Project

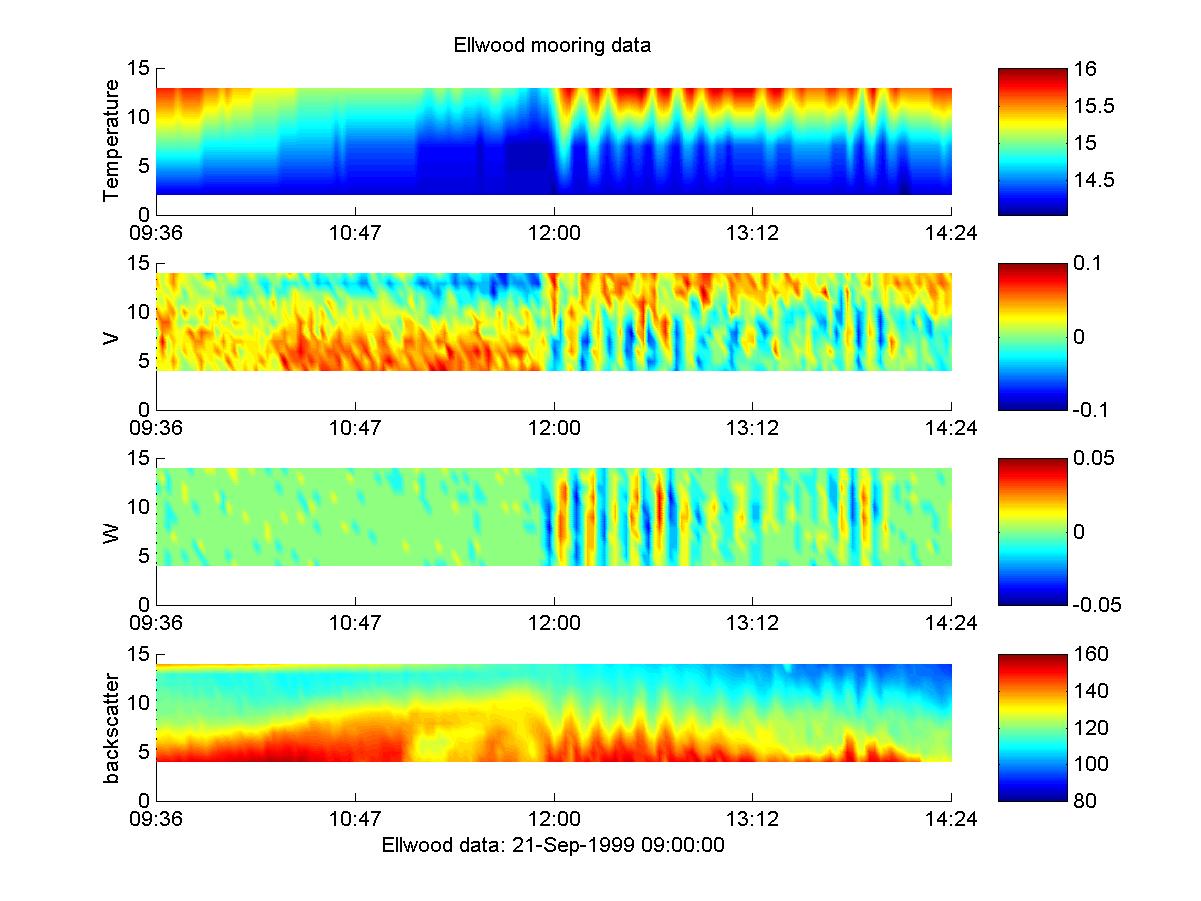
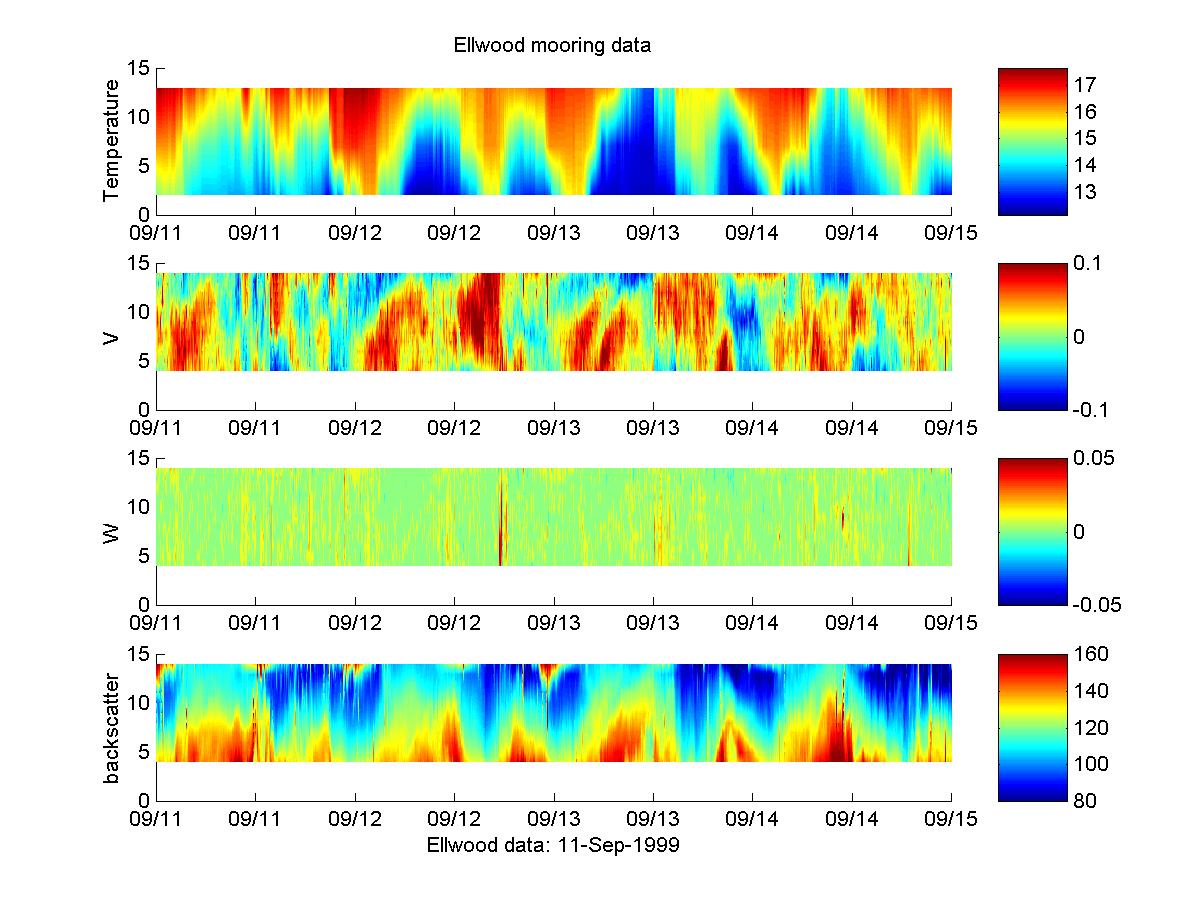
We have observed something rather interesting at Ellwood, the southernmost station. This (figure) shows some beautiful internal waves. This is a warm bore as described by Jesus Pineda. First a cold bore fills the water column and upwells at the coast, so from 10:47 to 12:00, currents are offshore at the surface (V<0) and onshore at the bottom. These currents push cold water offshore, forming a front with warm water. Due to gravitational instability or surface currents, the front collapses back toward the coast, so warm water appears suddenly at 12:00, along with onshore surface currents and offshore bottom currents. The front is followed by a train of internal waves, which make the thermocline oscillate up and down, and we see the vertical currents (W) going up/down/up/down. The internal waves also distort the near-bottom sediment layer, as shown in the backscatter plot. Pineda believes this sort of event can transport larvae onshore, aiding settlement. We see internal waves only in late summer, and in the Santa Barbara channel where the thermal stratification is greatest. As well as the high frequency internal waves (10 minute period), we also see diurnal internal tides (figure). Note that the cold water intrusions are associated with onshore currents, which may also aid larval transport just before settlemen.
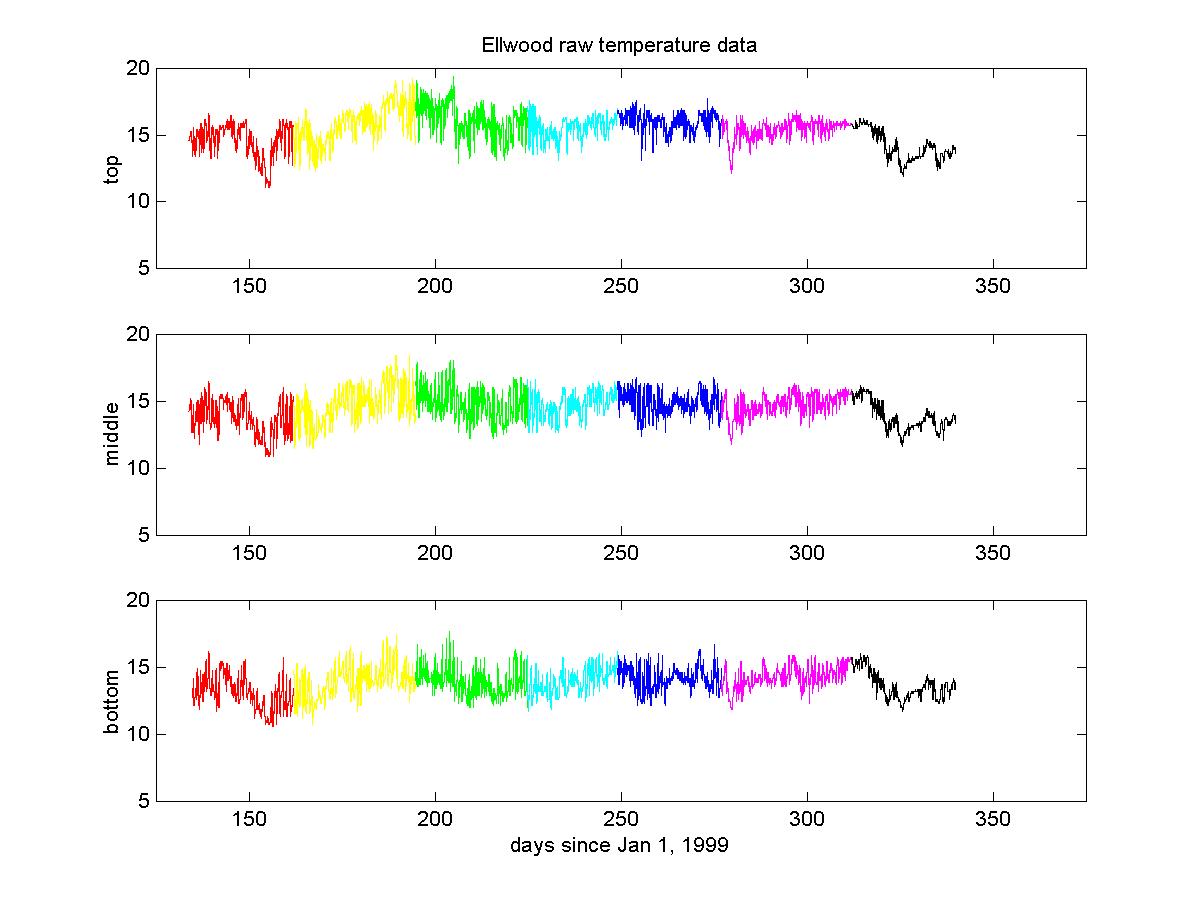
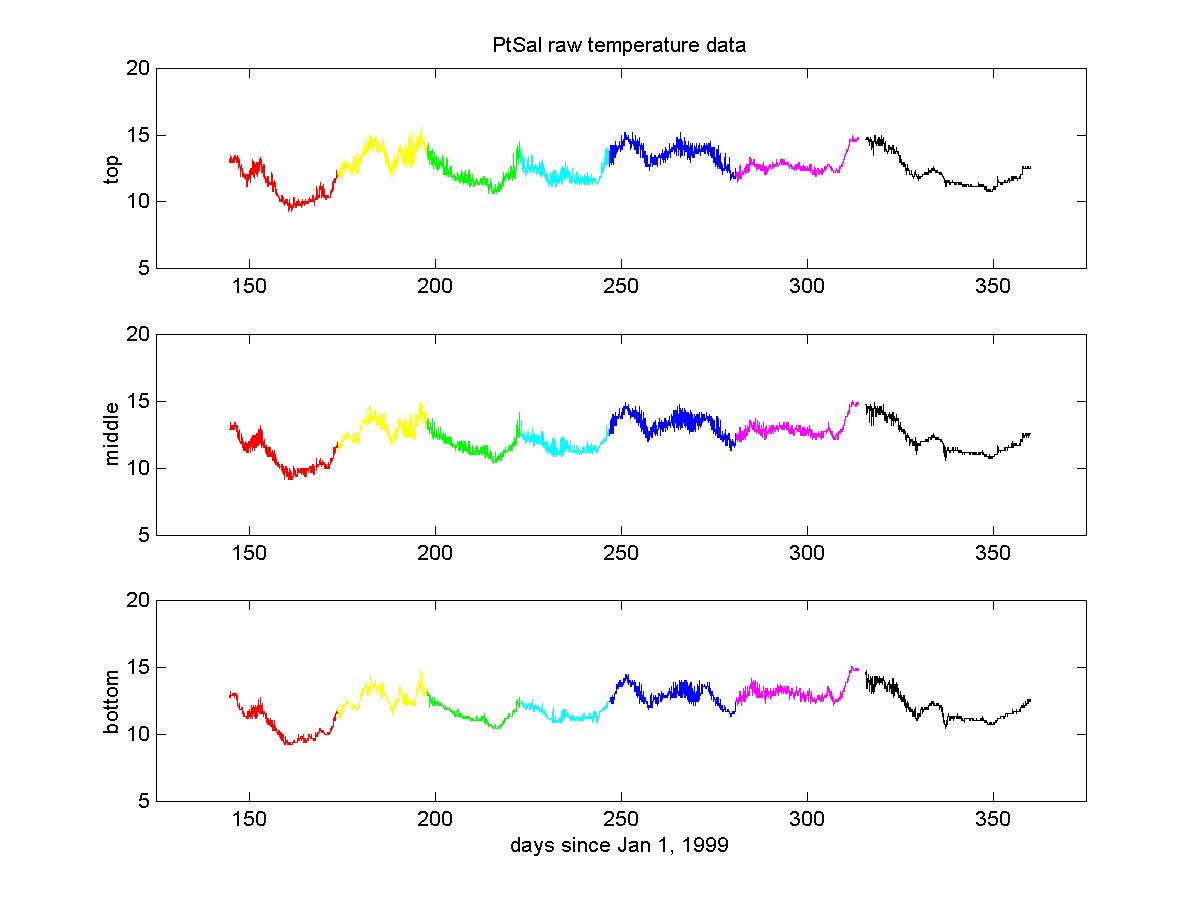
Compare the temperature data at Ellwood and Point Sal. In each figure, the three time series represent top, middle and bottom thermistor; the line changes color every time the thermistors were serviced. There's not much qualitative difference with depth at either station, although the water is cooler at the bottom. However, the Ellwood temperatures vary a lot on the minutes to hours timescales, while there is much less high frequency variation at Pt Sal. This difference indicates that there is more internal wave activity in the channel, as we also noted with the velocity data. The temperature time series at Pt Sal are dominated by variations over a week or so, or synoptic scale.